SQL Server Execution Plans for Developers: What to Look For
In my last post, I talked about common SQL Server mistakes developers should catch before production. One of the points I mentioned was that reading the execution plan can show warnings for some of those issues.
This post is the next step: a high-level introduction to SQL Server execution plans, how to start reading them, and a few common things developers should keep their eyes out for before code makes it to production.
You will not be a performance tuning wizard after this, as that is a much deeper rabbit hole, but you should have a better idea of where to look first and what should make you pause.
My settings
SQL Server 2025 Developer Enterprise
Set my instance to 2GB of RAM max
Set my instance to MAXDOP 2
Set my instance to Cost Threshold for Parallelism 50
The Stack Overflow 50GB database download from Brent Ozar
Originally from the 2013 dump https://archive.org/details/stackexchange
The values I’ve chosen are by no means magic settings for every machine. They are just the settings I’m running with so my desktop does not get completely eaten by SQL Server.
How to get the execution plan
To get the Actual Execution Plan to showup next time you run a query the quickest way is to open up a query window and use the short cut “Ctrl + M”
Alternatively you can use SSMS’s GUI to click the button at the top above the query window for Include Actual Execution Plan
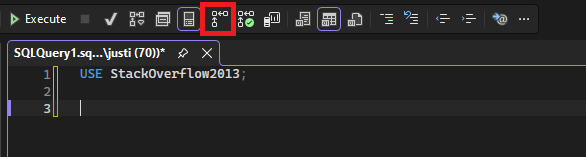
Where to find the Actual Execution Plan button
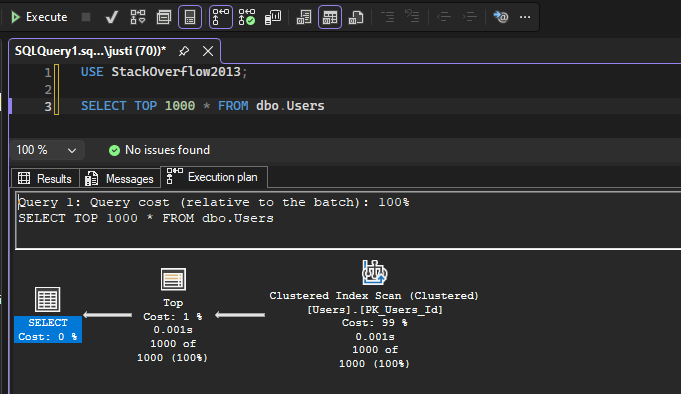
Once you have ran the query after getting it selected, you can see you find “Execution Plan” show up below the query, next to the “messages” and “results” that are normally there.
While there is also an “Estimated Execution Plan” we will be focusing on the actual one for this article.
How to read an Execution Plan
Execution plans are generally read from right to left. In this example, SQL Server starts by reading rows from Posts, uses those rows to find matching users from Users, joins the two sets together with a Nested Loops operator, then applies the TOP (100) before returning the final result.
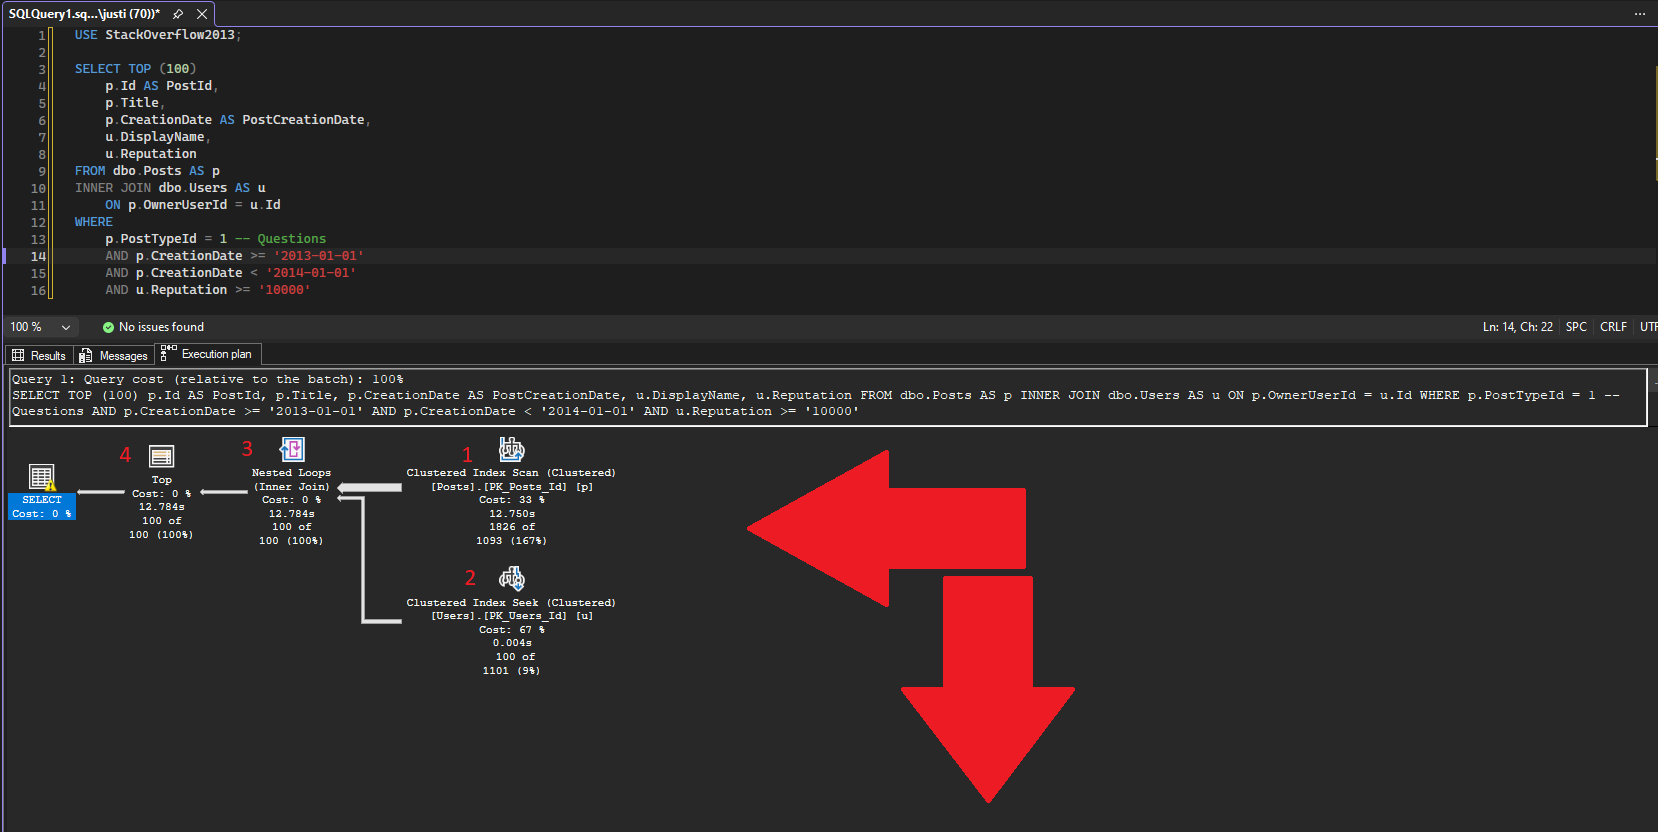
Read right to left, and top to bottom.
Query compilation timeout
One thing I really wanted to show in this post was a compilation timeout, but apparently I have lost my ability to be terrible enough at SQL to force one on demand. The basic idea is that before SQL Server runs your query, it has to compile it and choose an execution plan. For more complex queries, there can be a huge number of possible join orders, access methods, and operator choices. SQL Server will not search forever. If optimization takes too long, it may stop early and use the best plan it found within the time it was willing to spend compiling.
You can check for this in the execution plan properties window or in the XML. In the plan, click the SELECT operator and click “F4” to look in the properties window under the optimization-related details. In a healthy/simple case, you may see an optimization level like FULL or TRIVIAL, depending on the query.
The warning sign is when the plan shows that optimization ended early because of a timeout. In the XML, that can appear as:
StatementOptmEarlyAbortReason="TimeOut"
This does not mean the query failed. It means SQL Server stopped searching for a potentially better plan and moved forward with the best option it had found so far. For developers, the takeaway is simple: if you ever see an optimization timeout, it is a strong hint that the query may be too complex.
Spotting implicit conversion and other alerts
These will usually show up as a “yellow” warning/caution sign on an most operator in the execution plan. If you hover over it, it will at the bottom in a very cramped area try to list you all of them, however it often gets cut off.
Sometimes on the left most operator, but other cases like spills can show up as the yellow caution triangle also on sort operators for tempdb spills and in other places possibly.
You can either jump into the XML and find the warning section, or for these I do prefer to jump into the properties window by left clicking the left most operator, and then clicking “F4” on the keyboard. This will bring up the properties window, where at the bottom you can expand the aptly named “Warnings” section.
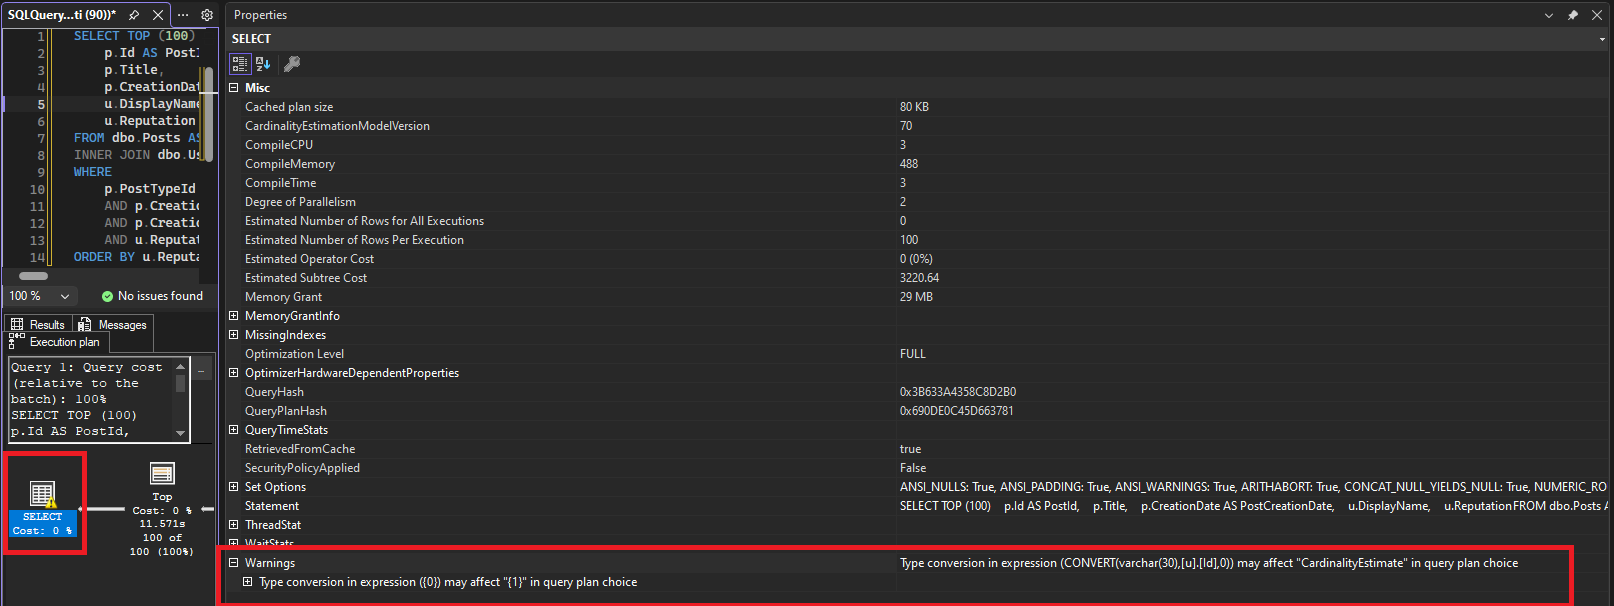
You can see the yellow caution sign, and the section for warnings in the properties window here
identify if your query is running in parallel or is single threaded
Many things can cause a query to not run in parallel, certain commands in SQL, anti patterns in the code, or possible SQL just did not think there was enough effort needed for multiple cores.
If your query is using multiple cores and running in parallel then you will notice the “yellow racing stripes” as some might call them, or a yellow circle with 2 arrows pointing left on each of the steps in your execution plan.
Below we can use the same query plan example as we will use below for our index recommendation portion, to see what this looks like.
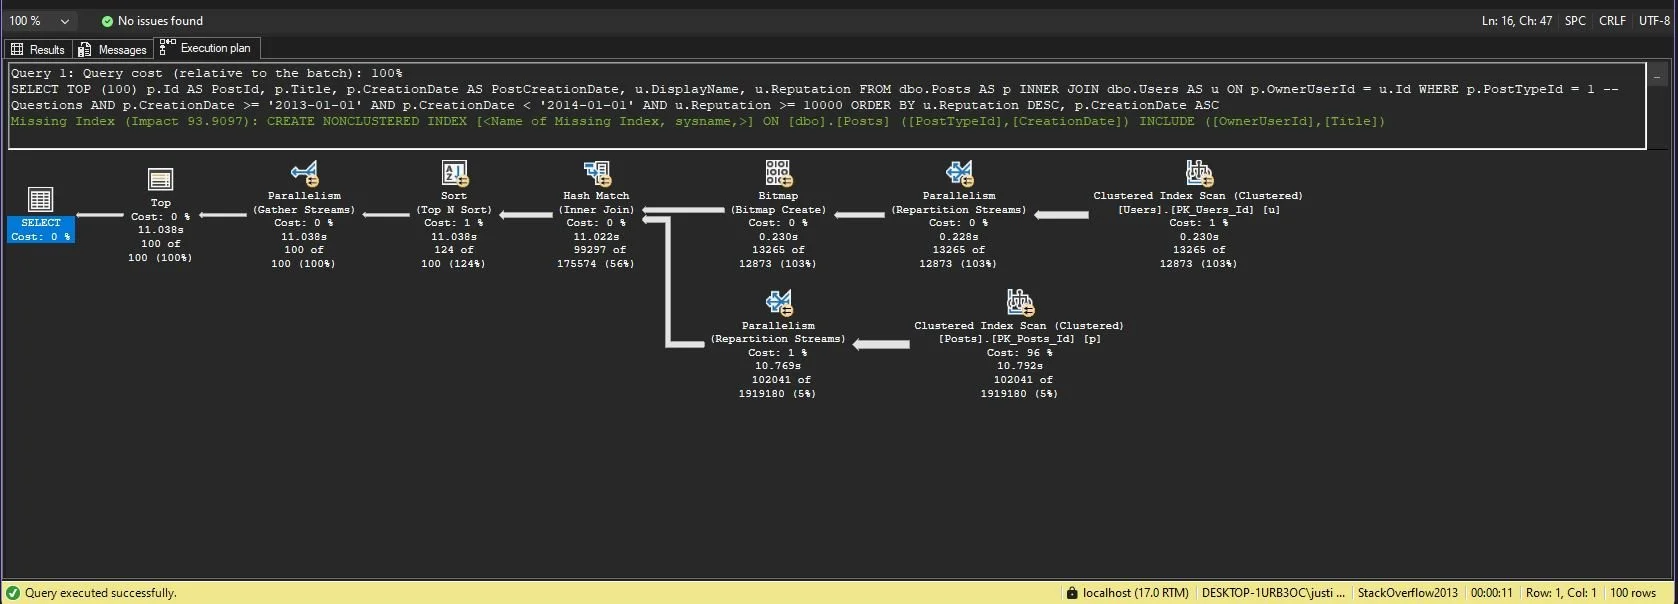
We can see each operation to the right of the “Top” has the yellow circle with 2 arrows, aka the racing stripes
Now a feature Microsoft updated with SQL Server 2022 is that inside the plan the “NonParallelPlanReason” was modified and updated to provide more clear options. To see this left click on the left most operator in the execution plan and click “F4” key. This brings up the properties window.
Then right about in the middle we can see something like:
NonParallelPlanReason MaxDOPSetToOne
So for that query I had introduced a forced MAXDOP 1 command so of course it could only run with one.
missing indexes
Actual execution plans will give you a best-effort of finding missing indexes, when they do show up, they show up as green text above the plan icons (I’ve always found it interesting that its green, and not red font). Just because there is one there however, does not mean that is the only one or even the best one for impact that was found.
Of course sometimes, it won’t find an index recommendation which does not mean by any means that there is no possible index to help.
SELECT TOP (100)
    p.Id AS PostId,
    p.Title,
    p.CreationDate AS PostCreationDate,
    u.DisplayName,
    u.Reputation
FROM dbo.Posts AS p
INNER JOIN dbo.Users AS u ON p.OwnerUserId = u.Id
WHERE
    p.PostTypeId = 1 -- Questions
    AND p.CreationDate >= '2013-01-01'
    AND p.CreationDate < '2014-01-01'
    AND u.Reputation >= 10000
ORDER BY u.Reputation DESC, p.CreationDate ASC
Here we can see the query plan, and the green text indicating the initial recommended index.
If you are lucky enough to get an index recommendation, you can then do the below to get the index scripted out for you.
right click anywhere around the execution plan icons
Click “Missing Index Details…”
Here is the output of what it gave me, for this index.
/*
Missing Index Details from SQLQuery2.sql - localhost.StackOverflow2013
The Query Processor estimates that implementing the following index could improve the query cost by 93.9097%.
*/

/*
USE [StackOverflow2013]
GO

CREATE NONCLUSTERED INDEX [<Name of Missing Index, sysname,>]
ON [dbo].[Posts] ([PostTypeId], [CreationDate])
INCLUDE ([OwnerUserId], [Title])
GO
*/
Now a oh so fun fact, you might assume that the index that is shown is the only one or that all the possible indexes found are shown, you would be wrong! The index shown here may neither be the only index, nor the one with the largest estimated impact.
So how do you confirm if that is true in your case? Lets take a look at this example.
On the execution plan lets dive into behind the scenes, after all while we get a visual the execution plan is just a good old XML document, which luckily we can access by:
right click anywhere around the execution plan icons
choose “Show Execution Plan XML…”
Now in this case here below we can see that there was 2 indexes with estimated impacts, and we know we were shown the index with 93% impact, and well look what’s below it! An index with an estimated impact of 97%!
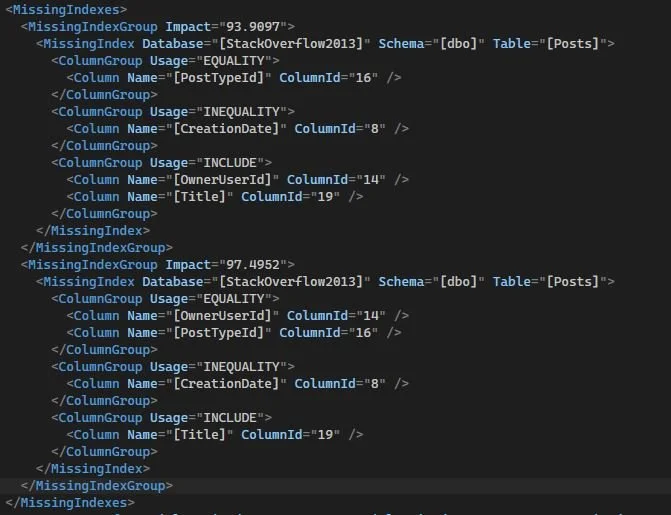
Here we can see that there was 2 separate indexes, and the one with 97% estimated impact was not shown to us
So make sure you take a look at the XML or open up the properties window to get a view behind the scenes to see if there are any other indexes not shown.
Now in this case we could probably draft a better index than either of those for the query, but that sounds like another problem for another blog!
So you’ve made it all the way down here and now know how to read an execution plan, and some of the key things I’d keep an eye for inside them as a start. Execution plans are an in depth topic and by no means have I managed to even scratch the topic.
But you should now be set for a good start of being able to look at one and identify at a high level some key possible issues and know how to read and get the properties window open along side with viewing the actual XML of the execution plan. This will prove key as not everything is always shown like index recommendations, plan warnings and some times you’ve got to dive in under the hood.
There are many other things worth learning in execution plans, like scans vs seeks, key lookups, join choices, memory grants, spills, and estimated vs actual rows. Those are deeper topics that deserve their own examples, because the answer is rarely as simple as “this operator is always bad.”